Search
Search Results
- Publication:
- [Washington, D.C.?] : [s.n.], [ca. 1870]
- Subject(s):
- Meteorology -- organization & administration
Telecommunications
Weather
Federal Government
Commerce
United States
- Publication:
- [Washington, D.C.?] : [publisher not identified], [1870?]
- Subject(s):
- Meteorology -- organization & administration
Telecommunications
Weather
Federal Government
Commerce
United States
- Author(s):
- Foster, Frank P. (Frank Pierce), 1841-1911
- Publication:
- New-York : John W. Amerman, printer, 1874
- Subject(s):
- Smallpox Vaccine -- therapeutic use
Smallpox -- prevention & control
United States
- Author(s):
- United States. Navy Department. Bureau of Medicine and Surgery, author.
- Publication:
- Washington : Government Printing Office, 1872
- Subject(s):
- Naval Medicine
Military Hygiene
United States
- Author(s):
- Tyndale, Theodore H. (Theodore Hilgard), -1917
- Publication:
- [Boston] : [Little, Brown?], [1877?]
- Subject(s):
- Coroners and Medical Examiners
United States
- Author(s):
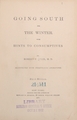
- Speir, Robert F.
- Publication:
- New York : Jenkins, 1875
- Subject(s):
- Health Resorts
Climate
Tuberculosis, Pulmonary -- therapy
United States
- Author(s):
- Woodward, Joseph Janvier, 1833-1884, author
- Publication:
- Philadelphia : [publisher not identified], 1876
- Subject(s):
- Hospitals, Military
Hospital Design and Construction
United States
United States. Army. Medical Department.
- Author(s):
- Barnes, William, 1824-1913, author
- Publication:
- Albany, N.Y. : Weed, Parsons, and Company, printers, 1871
- Subject(s):
- Insurance, Life
Financial Management -- standards
United States
- Author(s):
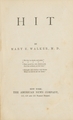
- Walker, Mary Edwards, 1832-1919
- Publication:
- New York : American News, c1871
- Subject(s):
- Social Problems
Women's Rights
United States
- Author(s):
- Toner, Joseph M. (Joseph Meredith), 1825-1896
- Publication:
- [United States : s.n., ca. 1875]
- Subject(s):
- Birth Rate -- trends
European Continental Ancestry Group
United States